Start a solar-production investigation by checking what was measured, which dates were compared and how the expected output was calculated. Then organize evidence for weather, shading, inverter limits and equipment events. A low monthly total or an unfamiliar graph shape is a reason to investigate; it is not, by itself, a diagnosis.
This guide helps solar owners and facilities staff prepare a useful service request. ClearTrade Report Editorial Team has not inspected your array, checked live equipment or performed a performance test. The framework is based on primary modeling sources and document review. It contains no electrical repair, roof-access or equipment-reset instructions.
Make the comparison describe the same thing
Identify the source of the actual number: inverter monitoring, a production meter, a utility bill or another report. Record whether it represents the whole array, one inverter, one group of modules or electricity exported to the grid. Do not treat unlike quantities as interchangeable simply because they appear on the same dashboard.
Power in kilowatts describes a rate at a moment or interval; energy in kilowatt-hours describes an accumulated amount. Compare the same units over the same period. A midday power reading and a monthly energy forecast do not answer the same question.
Keep production separate from the financial result. A bill or export credit raises additional questions about consumption, metering and tariff rules. For that distinction, see our net-metering and net-billing guide. This article focuses on evidence about solar output, rather than predicting the bill.
Check the data before interpreting the pattern
Save the original report or export, including the date range, time zone, interval length and last update shown. Note gaps, missing days and any change in the reporting source. Ask the service provider what the displayed values represent and whether the record is complete before assigning a physical cause to a blank or low value.
Preserve exact status messages and their timestamps. Do not translate a reporting message into a failed-component diagnosis. Include the equipment identity and the source of the message so the provider can consult the applicable instructions. A screenshot without a date or device context is much harder to interpret.
If you have several records, identify them separately instead of overwriting one with another. Ask the provider to explain any difference between totals, including the measurement boundary and period. This is a request to reconcile the evidence, not an instruction to open equipment or take electrical measurements.
Find out what the forecast assumed
Retrieve the proposal or model behind the expected output. Record the model version or document date, system capacity, inverter arrangement, orientation, weather source and stated loss assumptions. Ask whether the forecast represents typical weather, a particular historical year or another basis.
PVWatts cautions that its predictions include assumptions and uncertainties and represent site characteristics only as captured by the inputs. Its current calculator identifies separate loss categories, including shading, soiling, snow and availability. A quick estimate is not an observation of the actual site. PVWatts calculator and cautions.
The PVWatts interpretation guidance also distinguishes long-term modeled expectations from the results of a specific month or year. Use that distinction when requesting an explanation; do not turn an expected monthly figure into a guaranteed minimum or invent a universal percentage that proves a fault. PVWatts results guidance.
Keep a copy of the original assumptions before asking for a revised model. A changed loss allowance may improve the model, but the provider should explain why it changed. Adjusting inputs until the model matches a low result is not, by itself, an explanation of the result.
Build an evidence packet for the possible causes
Organize the records by question rather than picking a cause first. Weather, shading, equipment limits and reporting issues can require different evidence. The worksheet below helps make the service request specific without treating any observation as conclusive.
| Investigation question | Records to include | What remains to be established |
|---|---|---|
| Is the comparison consistent? | Units, measurement boundary, dates and time zone | Whether expected and actual figures describe the same quantity |
| Was the reporting complete? | Original export, gaps, update time and exact messages | Whether the recorded values adequately represent the period |
| What weather did the model use? | Forecast assumptions and proposed actual-weather comparison | How weather differences affect the comparison |
| Has the shading situation changed? | Existing shade study and dated observations from accessible locations | Whether the model represents the relevant obstruction and period |
| Is inverter limiting involved? | Inverter identity, ratings, interval data and event history | What the pattern means for this system and whether other issues remain |
| Is there equipment-event evidence? | Exact event text, affected devices and service history | The cause and appropriate response identified by the service provider |
A blank worksheet cell is a missing item of evidence. It is not proof that the corresponding cause is present or absent. Ask the provider which missing records are necessary and what can be concluded from the records already available.
Put weather and shading on the right timeline
Ask for a comparison that accounts for the weather during the actual reporting period, with its data source and limitations stated. Keep the same system description when evaluating the effect of changing the weather basis. Otherwise, several changed inputs can make the explanation difficult to follow.
For shading, preserve the original study or proposal assumptions and record the dates and locations of relevant observations. Ask whether the modeled shading description still represents the site. Do not assign an annual loss from one photograph or assume an observation at one time describes every season.
Keep soiling and snow observations distinct from shading, even if the records initially appear in the same report. The current PVWatts calculator treats these as separate model inputs. Ask which inputs were used and why; do not substitute generic defaults for a site assessment.
The owner’s role in this framework is to preserve and organize information available through ordinary records and accessible observations. The service provider should determine what additional inspection or analysis is needed. This article does not prescribe cleaning, vegetation removal or work on the array.
Treat clipping as an explanation to verify
An inverter has an AC output rating, and system modeling can include an upper output limit. Sandia’s inverter-model documentation identifies that limit as one of the model parameters. Use the actual inverter identity and system documentation when asking whether limiting explains a pattern. Sandia inverter model.
A flat-looking portion of a graph should lead to questions about interval resolution, ratings and operating records. It should not produce an automatic conclusion that the system is either healthy or faulty. Ask the provider to identify the evidence supporting the explanation and the effect on energy over the relevant period.
Sandia’s July 2021 research summary describes how clipping and other design or operational practices can mask performance problems. That is a reason to avoid treating apparent limiting as an all-clear. The article uses the public research summary, not a reproduced or independently tested diagnostic method. Sandia research summary.
Quantify the difference without inventing a verdict
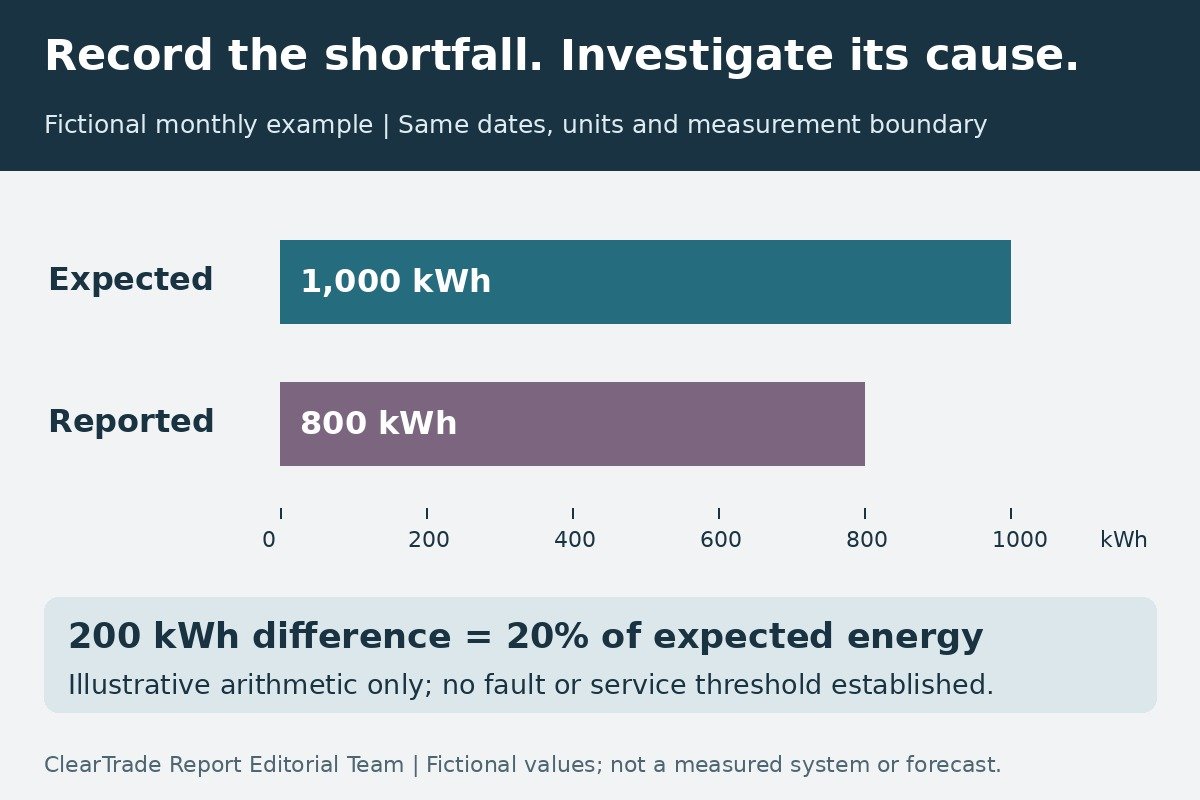
Consider a fictional record: expected energy is 1,000 kWh and reported energy is 800 kWh for the same month and measurement boundary. The difference is 200 kWh, or 20 percent of the expected figure. That arithmetic describes the comparison; it does not say whether the difference came from weather, model assumptions, incomplete reporting or equipment.
Record the basis beside the calculation. If one number describes a complete month and the other covers only part of it, resolve the mismatch before presenting the percentage as a meaningful comparison. If the expected figure changes after review, preserve both versions and the reason for the revision.
This example is invented to demonstrate recordkeeping. Twenty percent is not a service threshold, permissible loss, warranty criterion or predicted result for your system. Use the applicable contract and system evidence for those questions.
| Item in the fictional comparison | Recorded value |
|---|---|
| Expected energy and basis | 1,000 kWh; model and assumptions still need identification |
| Reported energy and basis | 800 kWh; reporting completeness still needs confirmation |
| Difference | 200 kWh, equal to 20 percent of the expected figure |
| Conclusion supported by arithmetic alone | A documented difference requiring explanation; no cause established |
Ask for an evidence-based service response
Send the provider the system identity, comparison period, original forecast, actual-data export, status messages and the completed portions of the worksheet. Ask for a response that identifies the measurement basis, explains the relevant pattern and separates confirmed findings from unresolved possibilities.
Request the date and scope of any inspection or analysis, the applicable manufacturer document when equipment interpretation is involved, and the next step for each unresolved issue. If a setting or component change is proposed, have the responsible provider document what changed and why. This guide does not authorize owners to change equipment settings.
Keep the response with the system’s original documents and service history. If the result is a revised expectation rather than a repair, retain the revised assumptions and explanation. If further work is required, keep the recommendation and its supporting evidence distinct from a claim that the issue has already been fixed.
Frequently asked questions
Does a low solar-production month prove an equipment fault?
No. First reconcile the measurement, reporting period, data completeness and forecast basis, then have the service provider evaluate the relevant evidence.
Is a forecast a guaranteed minimum output?
No. A modeled estimate contains assumptions. Any contractual guarantee must be checked separately against its actual terms and measurement basis.
Does a flat production graph prove normal inverter clipping?
No. Ask for an explanation supported by the actual equipment ratings, interval data and operating records; the graph shape alone does not establish the cause.
What should I send with a solar service request?
Send the system identity, exact dates, forecast assumptions, original production export, status messages and relevant service or site-change records.
Sources and scope
Primary sources checked October 27, 2026: current PVWatts calculator and interpretation guidance; Sandia PVPMC inverter-model documentation; Sandia public research summary SAND2021-4496J, published July 1, 2021. No site-specific model run, roof inspection, electrical measurement, manufacturer fault-code diagnosis, paid-paper review or hands-on test was performed. This guide makes no individual product recommendation, recall-clearance or warranty-coverage claim. No affiliate links, samples or sponsorship were used.
AI tools assisted with drafting. ClearTrade Report Editorial Team checked the cited sources and edited this guide. No hands-on inspection or testing was performed.
Need a qualified professional?
Trusted Pros uses visible license-verification states and never ranks paid listings above unpaid listings.