Data checked: October 26, 2026
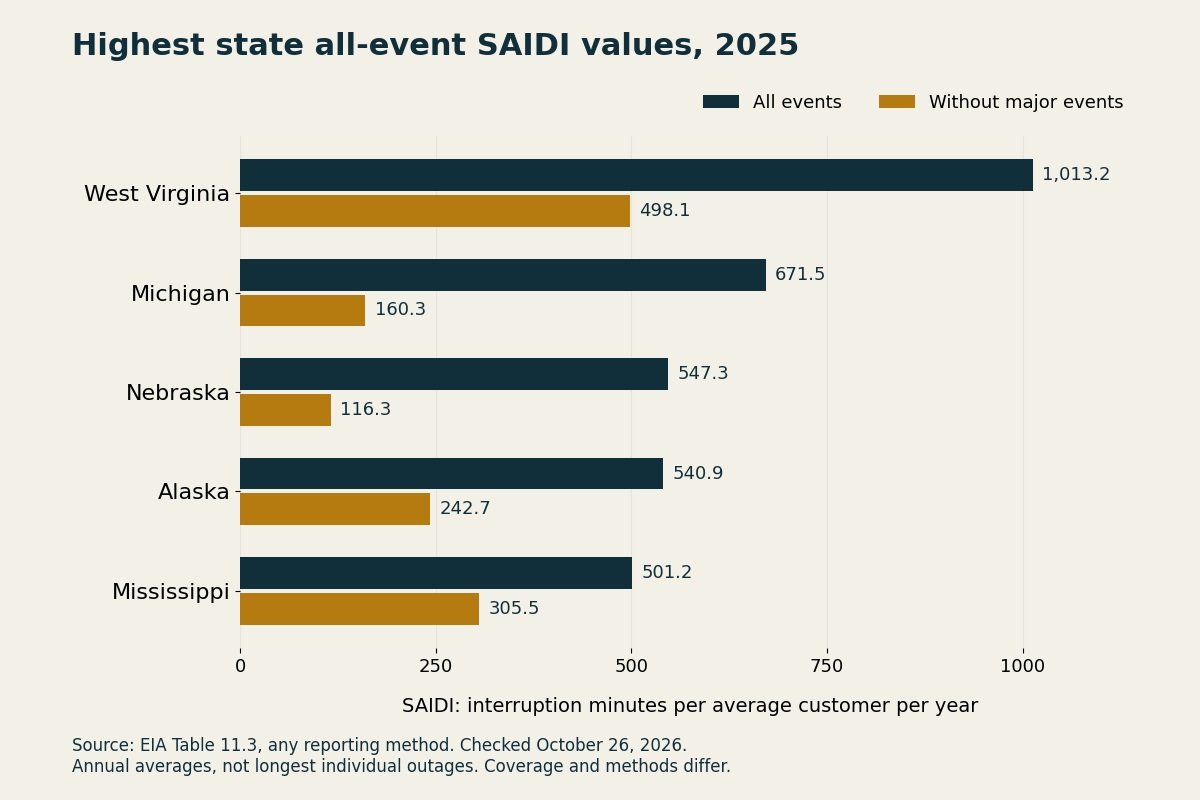
West Virginia had the highest 2025 all-events SAIDI among the state rows in EIA’s any-method reliability table. SAIDI describes annual interruption minutes per average customer; it does not identify the longest individual outage.
The distinction matters when comparing places to live, reviewing a facility’s resilience or shopping for backup power. Start by naming the metric, reporting year and event treatment. Then investigate the utility and property.
The five highest state values in this comparison
| State | 2025 all-events SAIDI, minutes | Without major events, minutes |
|---|---|---|
| West Virginia | 1,013.2 | 498.1 |
| Michigan | 671.5 | 160.3 |
| Nebraska | 547.3 | 116.3 |
| Alaska | 540.9 | 242.7 |
| Mississippi | 501.2 | 305.5 |
Source: EIA Table 11.3. ClearTrade compared state rows, excluding regional totals and the national total. This is an annual-duration ranking, not a ranking of the longest single incidents or the slowest crews.
Three metrics answer different questions
SAIDI measures annual interruption duration per average customer. SAIFI measures annual interruption frequency. CAIDI measures average restoration duration per interruption. EIA’s definitions concern non-momentary interruptions.
Ask which question you actually need answered. For a business repeatedly losing transactions when equipment restarts, frequency may be a useful starting point. For a building trying to understand annual downtime, total duration is relevant. For a backup-power design, none of these averages provides a worst-case runtime requirement.
A simple hypothetical illustrates why: two sites can each accumulate six hours without power. One might have six one-hour interruptions; the other might have one six-hour interruption. The annual total alone does not distinguish those experiences.
Keep the method and event treatment consistent
Table 11.3 mixes IEEE and non-IEEE reporting methods. Major-event definitions differ, and customer coverage is incomplete. EIA separately publishes an IEEE-method table with all-event, major-event-excluded and loss-of-supply-removed columns.
Our recommendation is to retain both the all-event and excluded-event views when reviewing a report. Label them clearly. Never compare one utility’s all-event result against another utility’s excluded-event result without explaining the difference.
The reporting population also matters. Narrower method consistency can come with narrower coverage. For example, the IEEE table reports 2025 customer coverage of 10.8% for Vermont and 23.6% for New York. It would be misleading to present either as a complete census of customer experience.
Before publishing or using a comparison, record the table number, year, method, units, exclusions and coverage. These details belong beside the analysis, not in a spreadsheet that the reader cannot see.
A Washington example
Washington’s all-events SAIDI fell from 623.5 minutes in 2024 to 372.5 in 2025; without-major-events values were 158.6 and 144.3. The all-events decline is about 40.3%, calculated from the published values.
That calculation describes a change in the aggregate. It does not establish its cause. To explain the change, request the utility’s event narrative and supporting records rather than attributing it automatically to maintenance, storms, investment or management.
Likewise, a statewide improvement does not prove an individual property improved. A property’s own interruption log can be more useful for choosing the questions to ask next.
Build a property-level evidence file
We recommend keeping the following information together before soliciting backup-power proposals:
| Evidence | What to record | Question it helps answer |
|---|---|---|
| Your interruption history | Date, approximate start and end, affected equipment | Which interruptions have actually disrupted the property? |
| Utility reliability report | Reporting area, year, methods and exclusions | Is this the same population as the state comparison? |
| Utility event explanation | Documented event causes and restoration account | What does the utility say happened? |
| Operations log | Restart time, lost work and equipment dependencies | Does power restoration also restore the operation? |
| Critical-load list | Equipment that must continue and what can wait | What should a designer evaluate for backup? |
| Desired outage scenarios | Short interruption, overnight outage and longer disruption | Which duration is the owner asking the proposal to address? |
These are planning records, not a substitute for utility records or engineering. Mark estimates as estimates. If your log says an outage lasted “most of the afternoon,” preserve that uncertainty instead of converting it into a precise measurement.
For a prospective property, ask the utility what historical information it can provide for the relevant service area. Ask the seller or facilities team for their own records as a separate source. Agreement between two sources is useful; a discrepancy is a reason to investigate.
Use reliability data to frame a backup discussion
A state number is a prompt for planning, not a battery-size calculator. Give a qualified designer the critical-load list, the interruptions you want to address and the operating constraints of the property.
Ask the proposal to state which loads are supported, how runtime was estimated, what happens at transfer, and what assumptions govern recharging or refueling. Identify what the owner must do during an extended interruption. Compare proposals against the same scenario before comparing their prices.
If a proposal promises to cover an “average outage,” ask which average it means and why that is the right target for your needs. Choosing a target is an owner decision informed by consequences, budget and design—not a result that drops automatically out of a state ranking.
Frequently asked questions
Does the highest SAIDI mean the longest individual outage?
No. It is an annual aggregate duration measure. Individual-event records answer a different question.
Can I compare numbers from different reporting methods?
Only with explicit qualifications. Prefer a consistent method, year and event treatment, and report the coverage limits.
Does a lower state average prove my address is more reliable?
No. Check utility-area evidence and the property’s interruption history.
Can I size a battery from these state figures?
No. Define the loads and outage scenarios the system must support, then have the proposed design evaluated against them.
Before requesting backup quotes, assemble the interruption log and critical-load list. Ask each provider to explain the scenario its proposal is designed to cover.
Related backup planning
Use the generator interlock and transfer-switch planning guide and home-battery critical-load sizing guide to frame equipment questions after defining your outage scenario.
For a separate market measure, see residential electricity prices by state. Average prices and reliability statistics answer different planning questions.
AI tools assisted with drafting. ClearTrade Report Editorial Team checked the cited sources and edited this guide. No hands-on inspection or testing was performed.
Need a qualified professional?
Trusted Pros uses visible license-verification states and never ranks paid listings above unpaid listings.